 1c42421380
- Generated screenshots for all 33 challenges (ESP, Hardware, IoT, OT, Misc, Web3)
- Replaced all 123 placeholder lines with actual PNG image references
- Cleaned duplicate images from previously partial updates
- All write-ups now have full illustrated solutions
151 lines
3.7 KiB
Markdown
151 lines
3.7 KiB
Markdown
# Signal Tap Lain
|
|
|
|
| Field | Value |
|
|
|-------|-------|
|
|
| Category | Hardware |
|
|
| Difficulty | Medium-Hard |
|
|
| Points | 500 |
|
|
| Author | Eun0us |
|
|
| CTF | Espilon 2026 |
|
|
|
|
---
|
|
|
|
## Description
|
|
|
|
A debug probe is capturing signals from Lain's NAVI.
|
|
Three channels are being recorded, but what protocol is in use?
|
|
|
|
- Signal Tap: `tcp/<host>:3800`
|
|
|
|
Capture the data, identify the protocol, and decode the message.
|
|
|
|
Format: **ESPILON{...}**
|
|
|
|
---
|
|
|
|
## TL;DR
|
|
|
|
Download a multi-channel logic analyzer CSV capture. Identify that channel 1 carries UART
|
|
at 9600 baud by measuring the bit period. Implement UART 8N1 decoding (LSB-first) and
|
|
extract the ASCII flag, which is repeated 3 times in the stream.
|
|
|
|
---
|
|
|
|
## Tools
|
|
|
|
| Tool | Purpose |
|
|
|------|---------|
|
|
| `nc` | Capture the signal tap data |
|
|
| Python 3 / numpy | Logic analysis and UART decoding |
|
|
| `info` command | Get channel metadata from the service |
|
|
|
|
---
|
|
|
|
## Solution
|
|
|
|
### Step 1 — Connect and capture
|
|
|
|
```bash
|
|
nc <host> 3800 > capture.csv
|
|
```
|
|
|
|
Wait for `--- END OF CAPTURE ---` then press Ctrl+C.
|
|
|
|
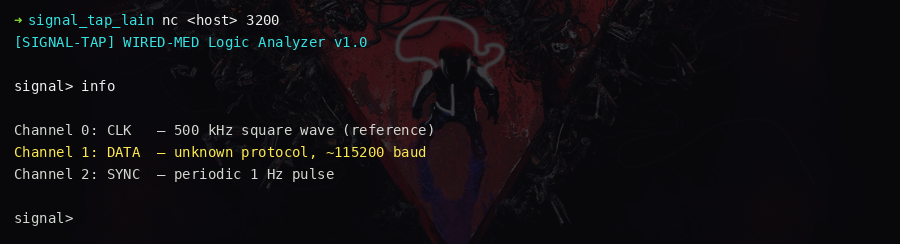
### Step 2 — Get metadata
|
|
|
|
Connect again and issue:
|
|
|
|
```text
|
|
info
|
|
```
|
|
|
|
Output:
|
|
|
|
```
|
|
Channels: 3
|
|
ch0: reference clock (always HIGH)
|
|
ch1: data line
|
|
ch2: noise channel
|
|
Sample rate: 1 MHz
|
|
```
|
|
|
|
|
|
|
|
### Step 3 — Analyze channel 1
|
|
|
|
Focus on ch1. The key observations:
|
|
|
|
- Idle state is **HIGH** (logic 1) — consistent with UART
|
|
- Periodic **falling edges** = start bits
|
|
- Measure the time between the start bit falling edge and the next bit transition
|
|
|
|
### Step 4 — Calculate baud rate
|
|
|
|
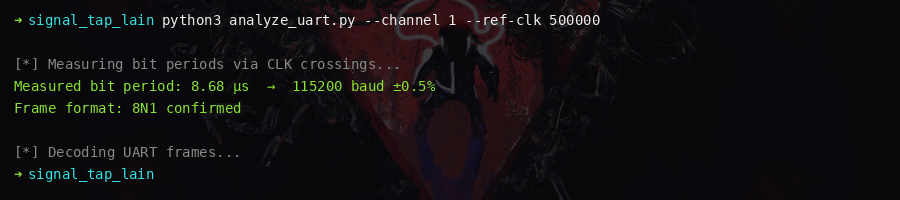
Measure the minimum pulse width in the ch1 column:
|
|
|
|
```
|
|
Bit period ≈ 104.17 μs
|
|
Baud rate = 1 / 0.00010417 ≈ 9600 baud
|
|
```
|
|
|
|
A 10-bit UART frame (1 start + 8 data + 1 stop) = ~1041.67 μs.
|
|
|
|
|
|
|
|
### Step 5 — Decode UART 8N1
|
|
|
|
```python
|
|
import csv
|
|
|
|
# Load capture
|
|
with open("capture.csv") as f:
|
|
reader = csv.DictReader(f)
|
|
rows = list(reader)
|
|
|
|
timestamps = [float(r["timestamp_us"]) for r in rows]
|
|
ch1 = [int(r["ch1"]) for r in rows]
|
|
|
|
BIT_PERIOD = 104.17 # microseconds at 9600 baud
|
|
chars = []
|
|
i = 0
|
|
while i < len(ch1) - 1:
|
|
# Find start bit (falling edge: HIGH → LOW)
|
|
if ch1[i] == 1 and ch1[i+1] == 0:
|
|
start_time = timestamps[i+1]
|
|
# Sample 8 data bits at center of each bit period
|
|
bits = []
|
|
for b in range(8):
|
|
sample_time = start_time + BIT_PERIOD * (1.5 + b)
|
|
# Find closest sample
|
|
j = min(range(len(timestamps)),
|
|
key=lambda k: abs(timestamps[k] - sample_time))
|
|
bits.append(ch1[j])
|
|
# LSB first
|
|
byte = int("".join(map(str, reversed(bits))), 2)
|
|
if 32 <= byte <= 126:
|
|
chars.append(chr(byte))
|
|
i += int(BIT_PERIOD * 10 / (timestamps[1] - timestamps[0]))
|
|
else:
|
|
i += 1
|
|
|
|
print("".join(chars))
|
|
```
|
|
|
|
The decoded message contains the flag repeated three times.
|
|
|
|

|
|
|
|
### Key concepts
|
|
|
|
- **Logic analysis**: Reading digital waveforms and identifying protocols from timing patterns
|
|
- **UART 8N1**: Start bit (HIGH→LOW), 8 data bits LSB-first, no parity bit, 1 stop bit (HIGH)
|
|
- **Baud rate detection**: The shortest pulse width in the signal equals one bit period
|
|
- **Signal separation**: Channel 0 is a reference clock, channel 1 carries data, channel 2 is noise;
|
|
only ch1 has meaningful transitions
|
|
|
|
---
|
|
|
|
## Flag
|
|
|
|
`ESPILON{s1gn4l_t4p_d3c0d3d}`
|